This post is compiled from a roughly 100-minute, 16-round conversation I had with Claude (Anthropic’s Claude Fable 5, high-effort mode). I’m writing it down for two reasons: first, to record an interesting chain of questions — we started from a Bilibili anti-gambling channel and ended up at the political economy of AI data centers; second, to record a working method for doing serious reading and research in collaboration with an AI. The second may be worth more than the first.
I. The Starting Point: A Question That Looked Small
If you live in the English-speaking world, the gambling boom is hard to miss. Since the U.S. Supreme Court struck down the federal sports-betting ban in Murphy v. NCAA (2018), the industry has grown to nearly $200 billion in annual wagers — roughly fifteen times the 2019 level — and a Washington Post analysis of televised games found betting promotions so fused into sports broadcasts as to be effectively inescapable. On Reddit, r/wallstreetbets turned posting screenshots of six-figure losses into a genre of entertainment — “loss porn,” a coping ritual that researchers have studied as a community institution in its own right. And prediction markets now quote live odds on everything from elections to sports to the weather, with billions of dollars a week changing hands around big events. China officially has almost none of this. Gambling is illegal, the betting apps don’t exist, and the entire industry operates offshore, in the dark. Which is why its most visible surface is so strange: a channel on Bilibili (roughly, China’s YouTube) called Jieshe — “Quit-Gambling Society” — where the host does exactly one thing on livestream: read aloud the confession letters that gamblers mail him. Students who lost their tuition, workers buried in loan-app debt, men who bet away the family home. The channel grew from 228,000 followers in early 2023 to about 1.4 million.
An underground industry whose most public face is a man reading letters about ruin — that was the observation I started from. I asked Claude: how big a problem are sports betting and debt addiction in China, really? Is there data? Any fieldwork?
The first answer set the tone for the whole conversation. After searching the web, Claude laid out evidence in layers: the annual scale of gambling-related capital outflows (over one trillion RMB) disclosed by a Ministry of Public Security official at a public forum; daily online-gambling user counts (over 11 million) from a Tencent Security Lab report; official enforcement statistics (4,500+ gambling platforms taken down in 2024); credit-penetration figures from a national report on young people’s consumer debt; and investigative reporting on “paofen” money-mule schemes — in one case in Yiwu, 95% of suspects were under 30, mostly students, recent graduates, and migrant workers.
But what made me decide to keep asking was the final paragraph of that answer. It volunteered the limitations of its own evidence: the official numbers are all enforcement statistics, measuring crackdown intensity rather than the size of the addicted population; the trillion-RMB outflow figure is a “preliminary estimate” with no published methodology; follower counts measure attention, and onlookers vastly outnumber the afflicted. Its conclusion: the qualitative judgment “this problem is big” is well supported, but “exactly how big” lacks a credible denominator.
An interlocutor who volunteers where its denominator is missing is worth continuing to question.
II. The Question Chain: How We Got from Sports Betting to Data Centers
Looking back at the transcript, this was not a ramble — every round interrogated the most restless link in the previous answer. Here is the chain, unfolded, with the key concepts taken slowly.
1. Scale is not an explanation
The data established that the problem exists, but not the real question: why do so many people, especially young people, choose a gamble they know has negative expected value? “Negative expected value” is not rhetoric — against black-market platforms, gamblers lose almost surely in the long run; money-mule participants earn a 1–2% commission per transaction while wagering their criminal record and credit history. This is a trade no rational calculation should ever make, yet tens of thousands of people are making it. The more people involved, the less “a few irrational individuals” works as an explanation — something systemic must be pushing.
2. First layer: the shape of supply
I pressed on the structural consequences of gambling prohibition. Claude’s framework was an explicit trade-off: the ban genuinely suppresses participation (availability is among the strongest predictors of problem gambling), but the cost is that all residual demand gets pushed into the worst possible supply. Legal markets at least have betting caps, cooling-off periods, and payout guarantees; offshore black-market platforms run the opposite playbook — rigged outcomes, withdrawal traps — and often the same channel that opens the betting table also lends you the money, so the debt spiral runs far faster than in a legal market. On the help-seeking side there is a double stigma: admitting a gambling addiction also means admitting participation in an illegal activity. The result is no epidemiological surveillance and no publicly funded treatment — which is why a single content creator reading letters on livestream ends up performing three functions at once: quasi-counseling, quasi-debt-advice, and quasi-public-education. That, in itself, is evidence of the vacuum.
Claude also gave the other side: the ban is not ineffective — if gambling were liberalized, given the elasticity of participation, the total number of addicts would very likely be higher; Singapore’s high-friction model (steep casino entry fees for residents) is a third reference path. So the problem with prohibition is not that it “doesn’t work,” but that it offers near-zero protection to the residual high-risk population.
Along the way, we audited one widely repeated claim: “pathological gambling rates among Chinese populations are systematically higher than in the West (2.5%–4% vs. 1%–2%).” How reliable is it? Claude’s assessment: directionally plausible, but the direct comparison rests on weak evidence. Two of the problems it dissected: first, incommensurable instruments — the Chinese-population studies lean heavily on the SOGS screen, a notoriously “wide ruler” prone to false positives in community samples, while the Western baselines mostly use stricter DSM structured interviews; measuring one group with a wide ruler and comparing against another measured with a strict one inflates the gap by construction. Second, sampling quality — one frequently cited study distributed 2,000 questionnaires to parents through Chinese-language schools with a 27.4% response rate: think about who answers a questionnaire about gambling, and you see the sample was skewed from the start. This exchange was the conversation’s best demonstration of taking citations seriously: take a popular conclusion apart and inspect the grade of every brick.
3. Second layer: demand — how expectations shape risk appetite
Supply explains what form gambling takes, not why people gamble. So the question escalated to motivation: how are individual risk preferences shaped by macro-level expectations? Claude brought in two research streams.
One is a classic proposition of institutional economics (the North lineage): when actors are uncertain about the long run, the rational response is to shorten one’s time horizon and chase quick liquidity. An intuitive analogy: a street vendor who doesn’t know whether the stall will still be his next year won’t renovate the shopfront or cultivate repeat customers — he’ll grab what he can, deal by deal. That isn’t myopia; it’s the environment putting a price on short-termism.
The other stream sits closer to the ground: lottery economics has a stable cross-country finding — the lower a group’s perceived mobility prospects, the more high-variance gambling products it buys. The most direct testimony comes from Franceschini and colleagues’ field interviews inside Southeast Asia’s scam compounds: beyond the trafficked, a substantial share went knowingly and voluntarily — low education, meager returns in county-level job markets, debts already on their backs. “One year out there beats ten years back home” recurs verbatim across the interviews. That profile matches China’s domestic money-mule cases (“95% under 30, mostly students and migrant workers”) almost exactly.
At this point I asked the question directly: does this system, structurally, produce the incentive to grab fast money and run? Claude’s answer drew on three books that happen to form a spectrum from the elite to the bottom.
At the top, Yuen Yuen Ang’s China’s Gilded Age unbundles “corruption” into four incommensurable types along two axes — elite or rank-and-file, one-sided theft or two-sided exchange — yielding petty theft, grand theft, speed money, and access money (elite exchange: paying for the channel to power). Her central claim: over three decades, China’s corruption structure concentrated heavily in access money, and this type acts on the economy not as sand but as steroids — it stimulates investment, accelerates deals, and spawns projects, boosting growth in the short run at the price of accumulating systemic risk (debt, property bubbles), misallocation, and inequality. That resolves the seeming paradox of “severe corruption alongside rapid growth”; America’s own Gilded Age — railroad barons and political machines — is the isomorphic precedent, hence her title. Her earlier work supplies the micro-foundation: local officials’ real compensation was deeply tied to their jurisdiction’s economic performance — in effect a profit-sharing contract embedded inside the bureaucracy, making officials quasi-shareholders of local growth. The dark side of a profit share is a cash-out option: when anti-corruption shifts from routine oversight to campaign-style enforcement — unpredictable, selective — the discount rate on that “equity” spikes, and the rational response is to accelerate the cash-out and arrange the exit.
Which hands the baton to Minxin Pei’s China’s Crony Capitalism. His core claim: the reforms of the late 1990s effectively decentralized control over state assets (land, mining rights, SOE equity) to local officials while leaving ownership undefined — controllers who are not owners, a gap he calls “decentralized predation”: whoever holds the seat monetizes it. The exit mechanism is the part most directly responsive to my question: because the monetized assets cannot survive retrospective scrutiny, the holder’s optimal strategy is to move family and assets out first — spouse and children emigrate, wealth exits through Hong Kong and offshore structures — while the official stays in post to keep extracting, ready to bolt. Chinese officialdom has a name for this: the “naked official” (裸官). A leaked 2011 report by the central bank’s anti-money-laundering bureau estimated that from the mid-1990s to 2008, sixteen to eighteen thousand officials and SOE managers fled the country with roughly RMB 800 billion — an in-system acknowledgment of the equilibrium. This is not individual moral failure; it is the equilibrium strategy under suspended property rights plus retroactive enforcement.
At the bottom sits the Franceschini team’s compound research, already met above — and the interface is telling: the compound bosses’ fortunes are often the overseas extension of exactly the crony networks Pei describes (domestic gray-market accumulation, exit to escape retroactive scrutiny, protection deals rebuilt with local elites abroad), while the compounds’ labor supply is the distributional dark side of the growth model Ang describes — the young people flung out of county economies, pricing high-variance strategies.
The synthesis: the same incentive structure, expressed at three rungs of the ladder. The unpredictability of property and personal security turns elites into naked officials, capital into offshore capital, and the young into compound labor. The only difference is which exit instrument each rung can afford. And “lying flat” belongs to the same coin: lying flat is the low-variance exit from competition; grabbing fast money and running is the high-variance exit — both share the premise of lost confidence in slow, legal accumulation.
Claude attached the counterweights unprompted. Andrew Wedeman’s Double Paradox is the standing rebuttal to Pei: Chinese corruption intensity is comparable to other East Asian developmental states, the crackdown — however flawed — has sufficed to keep corruption from becoming lethal, and “regime decay” is over-extrapolation; a decade on, the Pei–Wedeman disagreement remains unadjudicated. Nor is any of this China-specific: Russia in the 1990s and much of Southeast Asia show the same isomorphism — “weak property rights + high inequality → fast money + capital flight” is a general finding, and attributing it to any particular governance system would require cross-national research designs that most existing studies cannot deliver. And the official narrative has its own counter-reading: the very intensity of the crackdown shows the state treats this behavior as a threat rather than quietly licensing it; the shortage may be one of county-level economic opportunity — a development-stage problem, not a question of intent. Claude’s net verdict kept the two claims apart: the literal claim (“the system encourages going for broke”) does not hold — the repression is real; but the structural claim — that this institutional combination (property-rights uncertainty + campaign-style enforcement + narrowing mobility + the arbitrage space created by capital controls) persistently produces such behavior — is supported by multiple independent evidence chains, exhibiting the same shape from the naked officials down to the Myanmar compounds.
4. The push: objective and subjective evidence on narrowing mobility
“Going for broke” needs a push — why did the slow lane empty out? I asked next: is there empirical research on narrowing upward mobility? This round had the densest evidence of the conversation, with objective and subjective layers corroborating each other.
The core objective metric is intergenerational income elasticity (IGE) — plainly, “how well does a father’s income rank predict his son’s income rank?” The higher the number, the more strongly birth locks in destiny. Fan, Yi & Zhang (2021, AEJ: Economic Policy) measured it rising from 0.390 for the 1970–1980 birth cohort to 0.442 for the 1981–1988 cohort — that is, the later you were born, the more “whose family you were born into” explains, and this happened during deepening marketization. Zhou & Xie (2019, AJS) reach the same directional conclusion from occupational mobility. Liang Chen, James Lee and colleagues’ A Silent Revolution documented the historical high point of diversification in elite-university admissions, while subsequent research shows the rural share at top universities has since fallen sharply. And Piketty, Yang & Zucman (2019, AER), reconstructing national accounts, show wealth heavily concentrated in housing — whether a family “got on the property ladder in a first-tier city between 2000 and 2015,” a variable that is nearly pure luck plus birth, moves its wealth rank more than twenty years of diligent work.
Here Claude insisted on a distinction worth slowing down for: absolute and relative mobility are different things. For decades absolute mobility was enormous — nearly everyone lived better than their parents — but that came from growth itself: the whole income distribution was shifting upward, like an escalator everyone was standing on. While the escalator runs fast, “which step you’re standing on” doesn’t matter much; once it slows, the question of position is exposed. The narrative shift you may have sensed — “involution” and “lying flat” vocabulary exploding in the mid-2010s — lines up with the growth downshift. That is not a coincidence.
On the subjective layer, Martin Whyte’s national tracking surveys (2004/2009/2014) recorded declining agreement with “hard work is always rewarded” and a shift in how people attribute poverty — fewer respondents blaming “insufficient effort.” Behavioral data agree — what economists call “revealed preference”: ignore what people say, watch where they actually put their feet. Applications for the national civil-service exam rose from roughly 1.4 million in the mid-2010s to over 3.4 million by 2025.
5. The central proposition: belief depreciation, and the “two tails”
This round produced the conversation’s central proposition — and the concept that most needs to be explained properly.
The most counterintuitive finding of Whyte’s 2004 survey was that Chinese respondents were remarkably tolerant of inequality — more confident in individual effort than most transition countries, on some items more than Americans. Why? Because of a widely held belief: “I’m poor now, but hard work will turn it around.” Under that belief, a neighbor’s new BMW doesn’t provoke anger — it motivates, because you believe you’ll have one in five years. That belief is an extraordinarily valuable social asset — arguably the cheapest stability mechanism a state can own: it keeps very high inequality from converting into unrest, and it requires no police, because people choose, on their own, to keep standing in line. (The state appears to understand the asset’s value precisely: the barrage of official-media editorials denouncing “lying flat” as shameful is itself the best circumstantial evidence — a system watching this belief drain and trying, in print, to refill it.)
“Depreciation” refers to the erosion of that belief in the follow-up surveys. Once the belief depreciates, the same level of inequality carries a completely different social meaning — the neighbor’s BMW turns from motivation into provocation. Hence the proposition: to predict how many people will run money-mule schemes, head for the compounds, or lie flat, don’t watch the Gini coefficient (the level of inequality) — watch the rate of decay of the belief that effort pays (the acceptability of inequality). The key supporting fact is a timing mismatch: the Gini coefficient actually drifted down after 2008, yet the narratives of lying flat and high-risk speculation exploded after 2015 — level indicators can’t explain the timing; belief indicators can. A queueing metaphor: what makes a person abandon a queue is not how unfair the queue is, but whether he still believes the queue reaches the window. Belief is the variable that moves first; behavior follows.
Claude also offered an analogy that, as an investor, I understood instantly: the level of inequality is a stock on the balance sheet; the belief in opportunity is the market’s discount-rate assumption on future cash flows. Collapses usually come not from the stock deteriorating but from the discount assumption being revised down — same fundamentals, different valuation logic.
After the belief depreciates, where do people go? The answer is the “two tails” model. Picture career choice as picking a return distribution: paths like “join a big tech firm / run a business” are medium-variance — you might do well, you might get laid off at 35. Once people judge that “work steadily for ten years and rise” no longer pays, something counterintuitive happens: they don’t stay in the middle — they flee to both ends of the distribution at once —
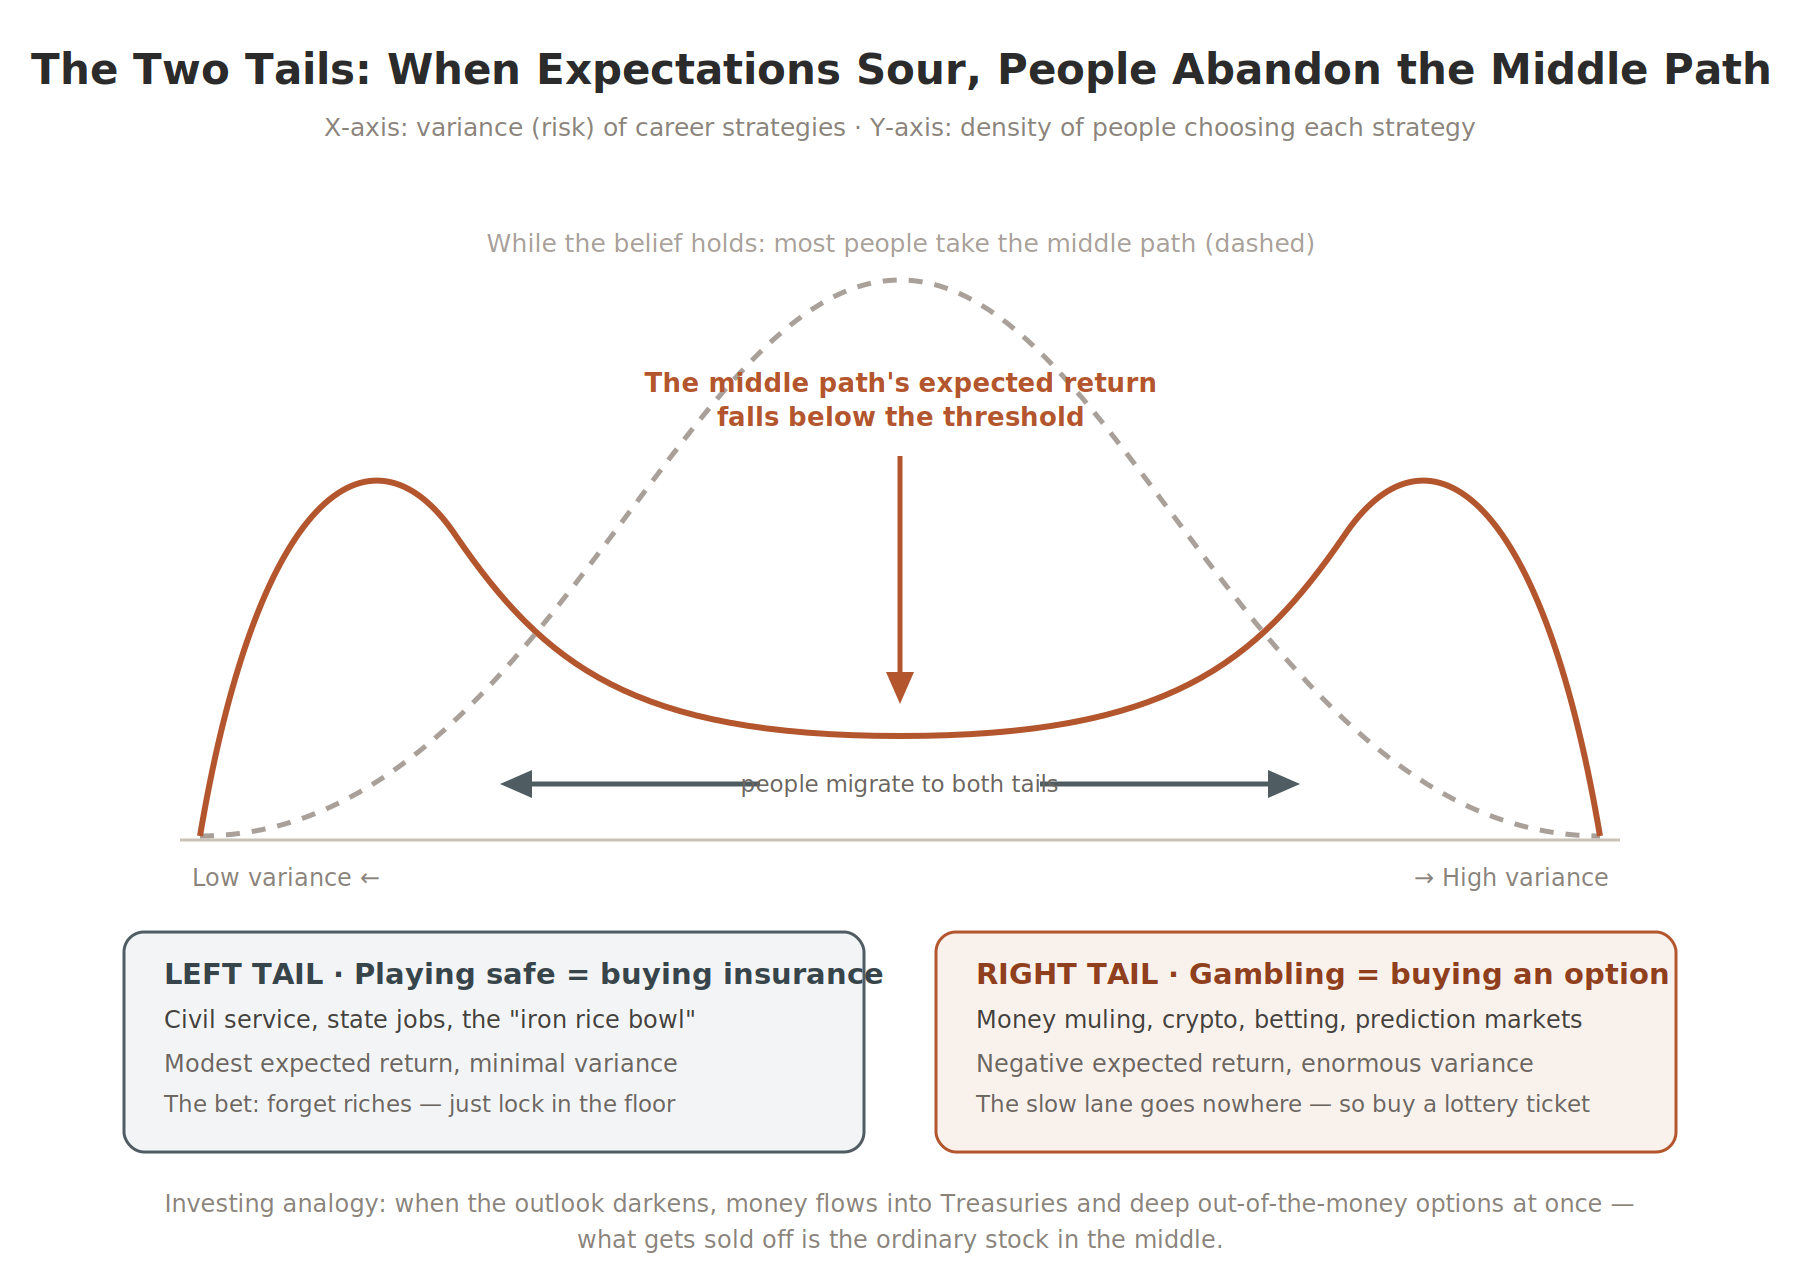
The left tail is playing safe — in essence, buying insurance. The expected return of a civil-service post is not high — the pay may be half a tech salary — but the variance is tiny; you almost cannot be fired. Choosing it says: I’ve given up on getting rich; I just want to lock in the floor. The right tail is gambling — in essence, buying an option. Money-mule schemes and going all-in on crypto have negative expected returns (the likely outcomes are a criminal record, a scam, or zero), but a small chance of making ten years’ income in one. Choosing it says: the slow lane won’t reach the destination anyway, so buy a lottery ticket. The two look opposite but share the same judgment: the middle path is no longer worth walking. That is why the civil-service exam boom and the money-mule surge can happen simultaneously, drawn from similar cohorts of young people — they are not a contradiction but two faces of one coin. Investors know this structure well: when the outlook darkens, money floods into Treasuries and far-out-of-the-money options at the same time, and what gets dumped is the ordinary stock in the middle.
6. The controlled comparison: America
Does belief depreciation exist in the United States? Yes — and the case file is more complete, with longer data series and more mature instruments.
The objective layer: Chetty’s team’s “Fading American Dream” (2017, Science) used tax data to measure the share of children out-earning their parents at age 30: roughly 90% for the 1940 birth cohort, falling to about 50% for those born in the 1980s — “kids doing better than their parents” went from a statistical norm to a coin flip. The mortality data: Case & Deaton’s “deaths of despair” work found that among middle-aged white Americans without a four-year degree, deaths from suicide, drugs, and alcohol were rising against the trend — in a wealthy country at peace, a mainstream demographic’s mortality curve turned upward. The crucial detail: the dividing line was not income but education — the people dying were not “the poor” but people whose social position had collapsed. Your father earned a home and dignity on a high-school diploma; you follow the same rules and can’t, and the surrounding narrative tells you the failure is personal.
The causal chain: Autor, Dorn & Hanson’s China Shock series (e.g., “When Work Disappears,” AER: Insights, 2019) exploited regional variation in exposure to import competition to show that harder-hit areas saw sharper declines in marriage, more single-parent households, and larger shifts in political attitudes — quasi-experimental evidence, at the community level, for the transmission from economic shock to social unraveling. The group portrait: Charles Murray’s Coming Apart used a clever design — deliberately studying only white Americans in order to remove race from the equation. Tracking two statistical communities over fifty years: elite “Belmont” barely changed, while blue-collar “Fishtown” saw marriage collapse from 84% to 48%. And that curve corresponds, almost frame for frame, to what William Julius Wilson documented in America’s inner cities back in the 1980s — whoever depended on the vanishing jobs walks this curve, regardless of skin color.
The queue metaphor from earlier, it turns out, has an American ethnographic twin. Arlie Hochschild spent five years in Tea Party Louisiana and distilled what she calls the “deep story” of Strangers in Their Own Land: you are waiting patiently in a long line toward the American Dream, the line has stopped moving, and — this is the part that burns — you perceive others being waved ahead of you. When she read this parable back to her subjects, they told her she had read their minds. Note what actually generates the rage: not the stillness of the line, but the perceived line-cutting. It is the attribution mechanism again, in field notes.
7. The immigration siphon: the hedge China doesn’t have
The comparison surfaces one structural asymmetry China entirely lacks. When the opportunity belief depreciates at home, America has historically been able to import fresh believers from the whole world. Self-selection guarantees the arrivals are precisely the people who believe hardest that effort pays — which is part of why Alesina, Stantcheva & Teso (2018, AER) find that Americans systematically overestimate their country’s mobility while Europeans underestimate theirs: immigrant upward mobility is real, and it keeps refilling the average narrative. The siphon’s scale is enormous — the foreign-born make up roughly 30% of the U.S. STEM workforce and about half of its doctorate-level STEM workforce, much of it entering through universities. As the line goes, America’s talent-recruitment program is called graduate school.
Since 2025, however, this pipe has been visibly narrowing, and the contraction is quantifiable. At the student inlet, F-1 visa issuance ran about a third below recent norms by September 2025, international-student arrivals fell 19% for the 2025–26 year, and new enrollment dropped 17% fall-over-fall — with Indian student visas down roughly 40%. At the work-visa link, a $100,000 fee now applies to new H-1B petitions (the previous cost was a few thousand dollars), and a wage-weighted lottery announced in late 2025 cuts an entry-level applicant’s selection odds nearly in half — severing precisely the study-to-work bridge. The economic reaction is already measurable: one bank cut its U.S. growth forecast after the fee announcement, and the Richmond Fed’s review of the evidence notes that past H-1B tightening mostly pushed the jobs abroad — to Canada and India — rather than to native workers. Competitors are moving into the gap: China launched a K visa explicitly benchmarked against the H-1B, a move Brookings reads as a direct economic rival exploiting American self-restriction, while Europe and other destinations expand their own high-skill channels.
Two stress tests before accepting the decline narrative, both supplied by Claude unprompted. First, the H-1B remains massively oversubscribed — the FY2027 quota was exhausted within weeks of opening — so the problem is a narrowing valve, not vanishing pressure. Second, the alternative destinations have limited absorption capacity: Canada has been cutting its own immigration targets since 2024, and China’s K visa faces a triple discount of language, pay, and institutional trust — for top talent, the current second-best is dispersal across many countries, not a single substitute hub.
The synthesis ties back to the main line of the essay. America could afford the slow depreciation of its domestic opportunity belief partly because the siphon kept replenishing both high-belief population and top human capital — the key difference between it and other belief-depreciating societies like Japan or Southern Europe. The current policy shift amounts to deliberately shrinking this hedge, timed precisely at the window when AI competition most demands talent density (international students make up roughly three-quarters of full-time graduate students in AI-relevant fields at U.S. universities). If China’s problem is belief depreciation with no vent, the risk America is now manufacturing is belief depreciation while dismantling its historically most effective replenishment mechanism. The two systems are running, in effect, a controlled experiment on the sustainability of opportunity narratives — which makes the previous section’s title, “the controlled comparison,” more literal than it first appeared.
8. The theoretical hub: the cascade model
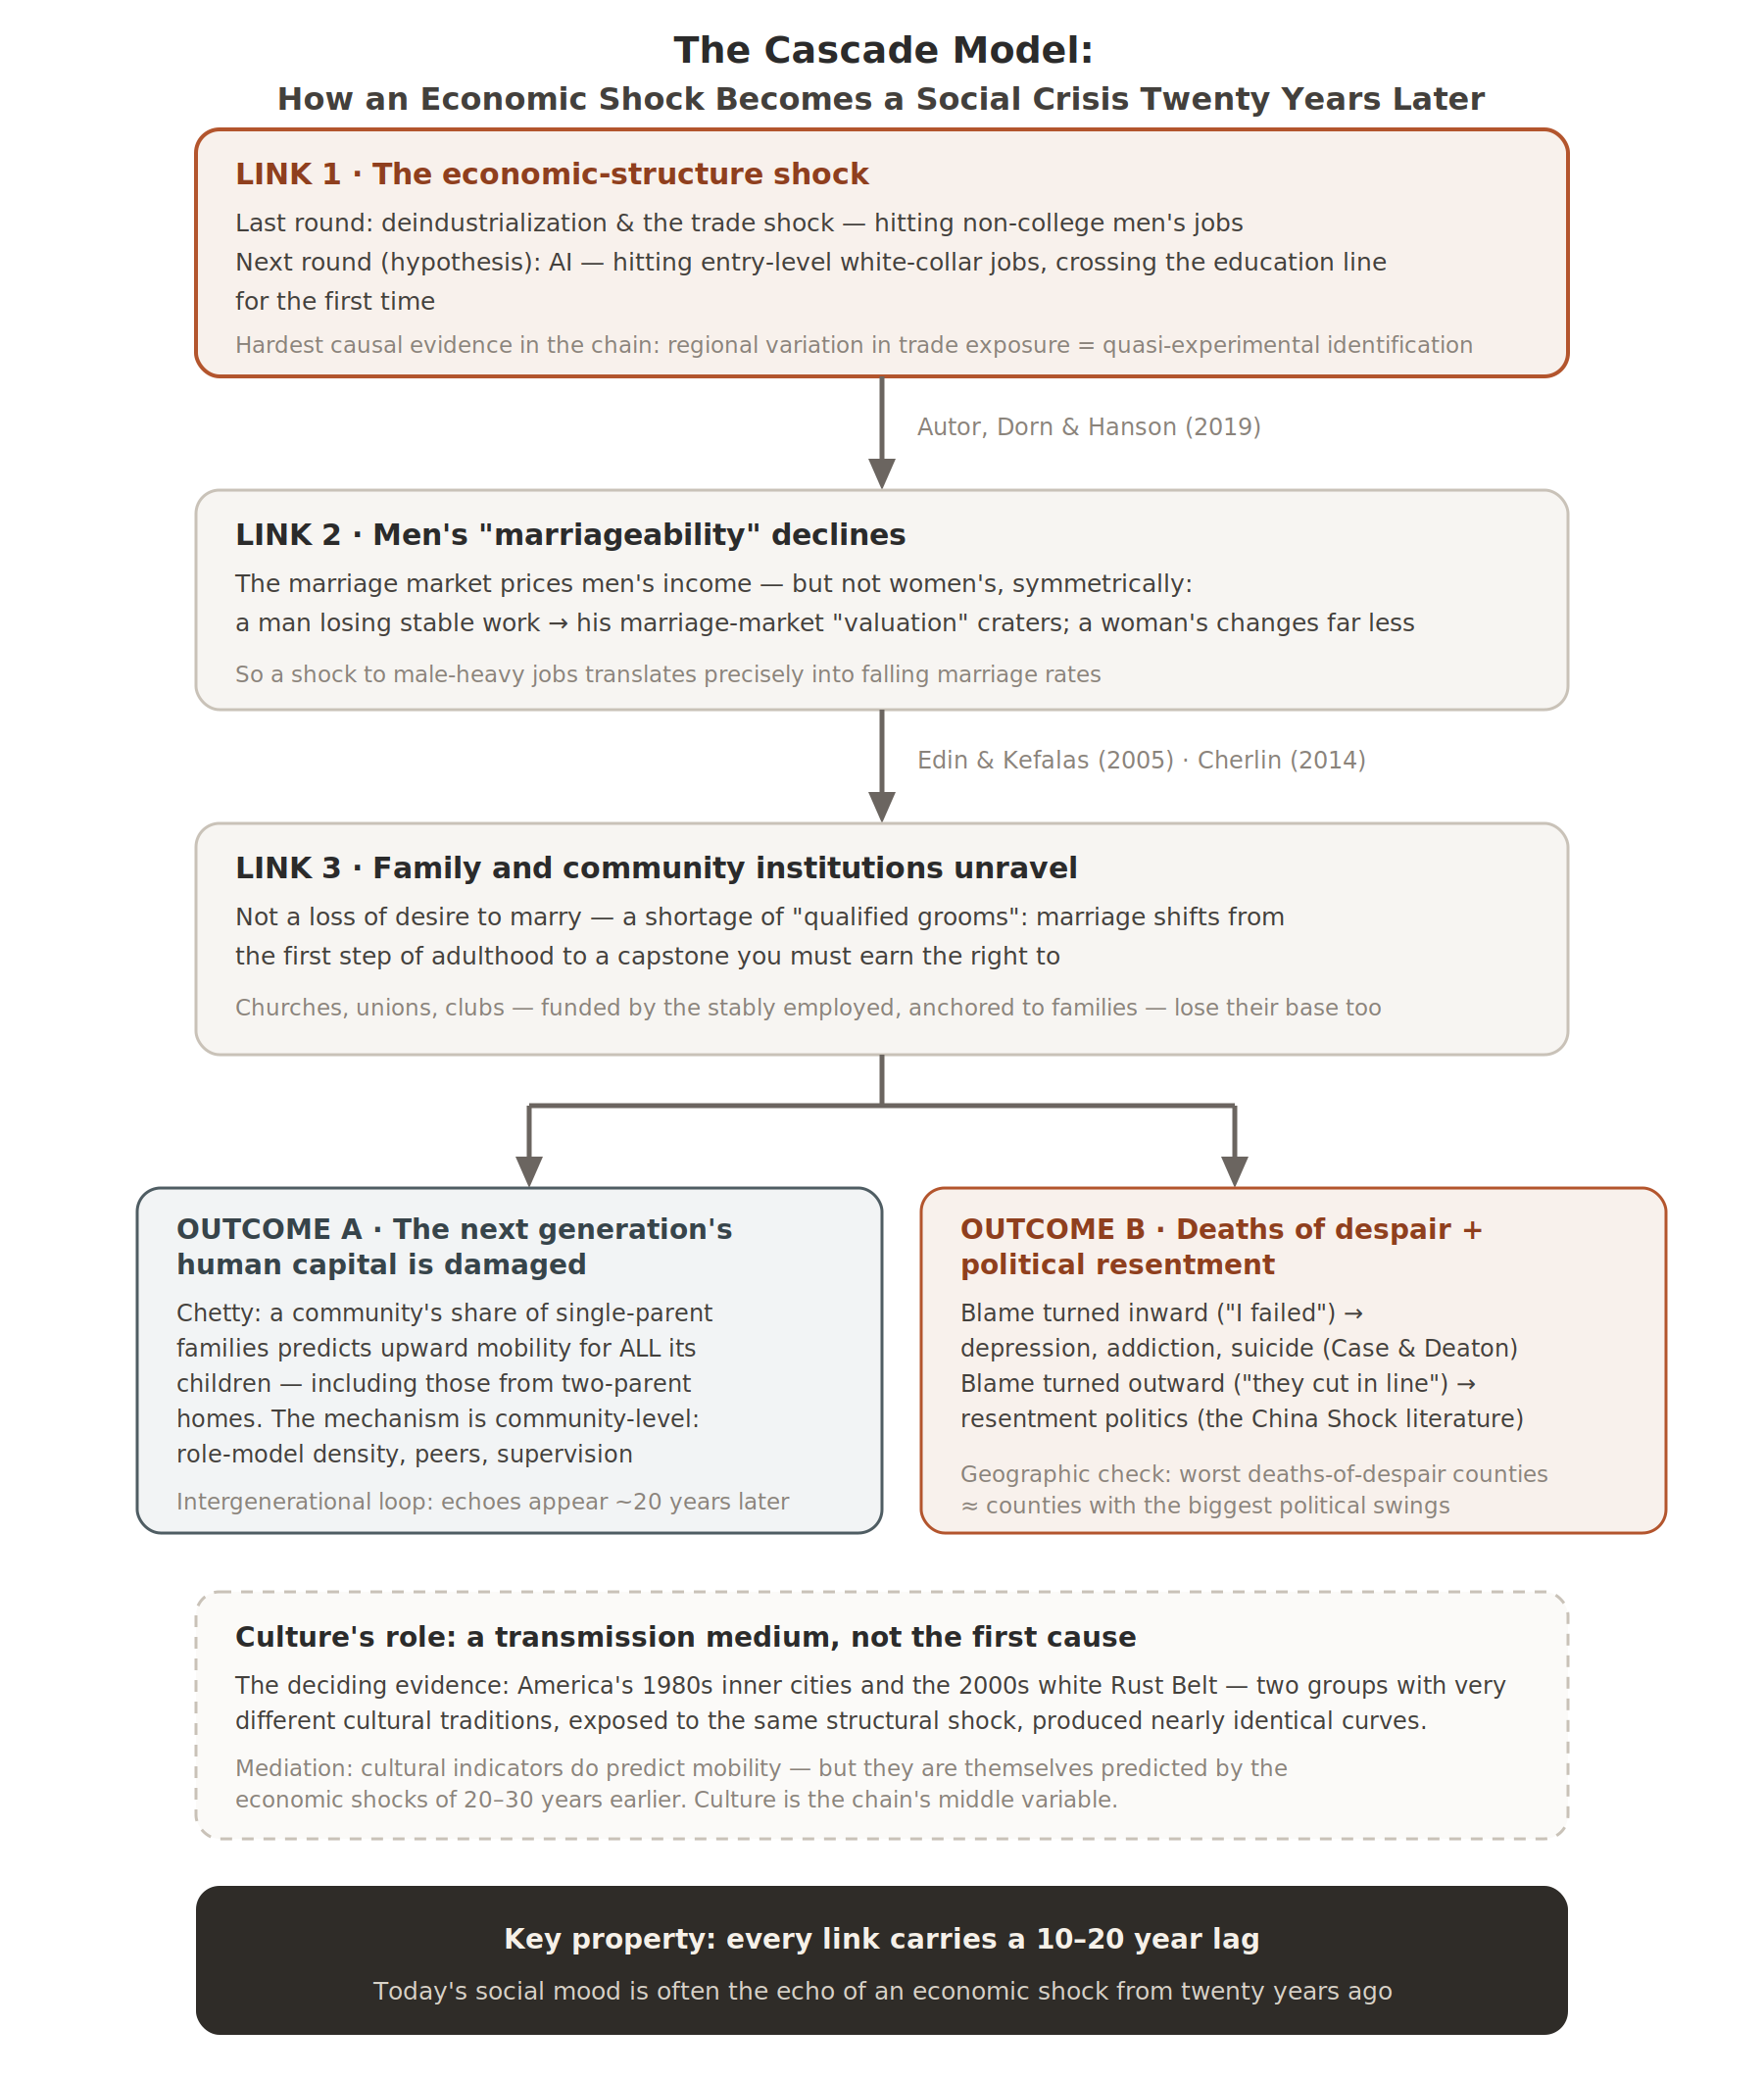
At this point, the pathology of both countries was distilled into one portable model. It deserves a diagram:
Link by link:
Link 1: economic shock → men’s “marriageability” declines. Here is a finding that looks odd at first: the marriage market prices men’s income, but does not price women’s income symmetrically. Where men’s earnings or job prospects improve, marriage rates rise; when a man loses stable work, his marriage-market “valuation” craters. When a woman loses a job, her valuation moves far less. This is why deindustrialization — which destroyed male-dominated manufacturing jobs — translated so precisely into collapsing marriage rates: what got destroyed was exactly the attribute the market prices.
Link 2: declining marriageability → family unraveling. Note that this link runs on a counterintuitive mechanism: it is not that the poor undervalue marriage — they value it too much. Edin & Kefalas’s Promises I Can Keep, five years of fieldwork in low-income Philadelphia neighborhoods with in-depth interviews of 162 young mothers, found their ideal standards for marriage matched or exceeded the middle class’s — a house, stable dual income, certainty the man is reliable. Marriage, in their minds, is a capstone achievement, not the first step of adulthood; precisely because the standard is high, they refuse to “waste” it on an economically unstable man. The problem: in their dating pool, the qualified grooms have already been removed by Link 1’s economic structure.
Then why have children first? Ask about opportunity cost — relative to what. For a Belmont woman, having a child at 25 costs a graduate degree, the ascent phase of a career, human capital mid-compounding — an astronomical price, so she waits until 33. For the women in the fieldwork, the foreseeable career path is a lateral shuffle between cashier and care aide — postponing childbirth buys nothing; the opportunity cost approaches zero. And the benefit side flips: in an environment of meaningless work and high-churn relationships, a child is one of the very few sources of meaning that is certain, cannot lay you off, and will not betray you. The phrase that recurs across the interviews is “my kid saved me.” Hence a life sequence that looks “backwards” from a middle-class vantage: children first (the affordable meaning), marriage suspended indefinitely (the unaffordable luxury). This is not short-sightedness; given the constraints, it is a remarkably coherent choice.
Link 3’s two outlets. The first outlet points at the next generation, via a Chetty finding worth slowing down for. Comparing American neighborhoods with tax data: the higher a community’s share of single-parent families, the lower the upward mobility of the children who grow up there — nothing surprising yet. The surprise is that the penalty falls on all the community’s children, including those whose own parents’ marriages are intact. Consider what that implies. If the damage were purely internal to single-parent households (a family-level mechanism), children from two-parent homes in the same neighborhood should be unscathed — but the data say they are hit too. The only reading that fits is that the operative variable is the neighborhood’s whole environment (a community-level mechanism): how many stably employed men are around to serve as role models, what life expectations circulate in the peer group, how many adults are watching the street after school. Family breakdown destroys not individual families but an entire community’s child-raising ecology. Add the time dimension — these children won’t enter the labor market for another twenty years — and a shock’s damage to the next generation only becomes legible in education and income data two decades on. That is one source of the cascade model’s signature lag. The second outlet lands on the adults themselves, and its direction depends on attribution: blame turned inward (“I failed”) leads to depression, addiction, suicide; blame turned outward (“they cut in line”) leads to resentment politics. The two outlets can be cross-checked geographically: plot the counties with the worst deaths of despair against the counties with the biggest political swings around 2016, and the maps largely overlap — evidence of a common upstream shock; but they do not overlap perfectly, and the mismatch reveals the mechanism: what decides whether the pain goes inward or outward is how much organizational capacity a community has left. Where churches, unions, and neighborhood networks have dissolved and everyone is atomized, the energy can only be metabolized inward, showing up as mortality; where some collective organization survives, the energy gets mobilized outward, showing up as political voice. One energy, two phases.
Why is culture a transmission medium rather than the first cause? Honesty first: this is a live academic dispute, and Murray himself stands on the other side of it. His reading of his own data is cultural — Belmont kept the founding virtues (marriage, industriousness, honesty, religiosity), Fishtown lost them, and the culprits are a welfare state that weakened the necessity of work and marriage, plus an elite that “practices but no longer preaches.” So the fact that “the elite barely moved for fifty years” adjudicates nothing by itself: it is perfectly compatible with a culture-first story in which culture diverged by class. The real adjudication rests on three harder pieces of evidence.
The first is temporal ordering and mediation structure. Chetty’s county-level mobility maps show that what predicts a place’s upward mobility really is the “cultural” indicators — single-parenthood rates, social capital — so far, Murray is right. But stretch the time axis, and those same cultural indicators are themselves predicted by the economic shocks of twenty to thirty years earlier. If shock S predicts culture A, culture A predicts outcome B, and the ordering is S before A before B, the most parsimonious reading is S→A→B: culture is the chain’s middle variable — which is precisely what “transmission medium” means. It also answers why Belmont’s norms held: not because elite morality is sturdier, but because the economic foundation under those norms (stable well-paid work, ever-rising returns to education) kept thickening for the elite while being pulled out from under Fishtown. Cherlin’s historical work adds the long view: for over a century, American working-class family stability has tracked the availability of stable male wages — the 1950s “golden age of the family” was itself a wage phenomenon, not a virtue phenomenon.
The second is quasi-experimental geography. The China Shock research shows family unraveling distributed along the map of import exposure and paced by the timetable of the trade shock. A culture-first account has to answer an awkward question: why would norm-loosening spread precisely along county lines, graded by exposure intensity? Culture does not jump discontinuously along tariff schedules; employment does.
Only third comes the “frame-for-frame replay” — and its polemical context should be restored. When Wilson advanced the “marriageable men” hypothesis in the 1980s, he was arguing against the then-dominant narrative that attributed Black inner-city family collapse to “Black culture”; his answer was that it was the downstream result of disappearing work, not a cultural pathology. Two to three decades later, a group with an entirely different cultural tradition — the white Rust Belt — walked the same curve after its own jobs vanished. That is the out-of-sample validation Wilson’s hypothesis waited thirty years for: if the first cause were some group’s particular culture, a culturally different group should not reproduce the same output under the same structural input. (There is a glaring political asymmetry here: when Black communities went through this, the mainstream narrative was moral condemnation; when white communities did, the narrative became “despair” and sympathy.)
The conclusion that survives all this is not “culture does nothing,” but that culture’s real role is amplifier and delay line: it shapes the speed and form of the collapse — religiosity buffered parts of the South for the first decade; the same first link in Japan outputs hikikomori and lifelong singlehood rather than single parenthood — but it does not decide whether the collapse happens.
Finally, two residual uncertainties must be stated — they are real cards in the other camp’s hand, not politeness. The first card is welfare incentives. Murray’s argument is not merely “culture decayed on its own”; it has an economic version: welfare policy itself changed the payoff calculation around marriage and work — many U.S. benefit programs carry a “marriage penalty,” where a single mother who marries an employed man sees her benefits cut or eliminated, and the expansion of disability rolls offered an income option outside work. That is a genuine threat to the timing evidence above: I say “the economic foundation under marriage was pulled away,” and Murray can answer, “yes — but what pulled it wasn’t only deindustrialization; the welfare rules were pulling too.” With two upstream variables moving at once, “shock precedes cultural change” cannot separate them. The second card is selection. Chetty’s community research is observational: families are not randomly assigned to neighborhoods — they choose them. So “even two-parent children are harmed in declining neighborhoods” admits a rival reading: the two-parent families who stay in (or move into) declining neighborhoods may already differ from those who leave along unseen dimensions — income, stability, ambition — and the children’s gap may come from the sorting of families rather than the toxicity of the place. Chetty’s team greatly mitigates this with a move-timing design (comparing siblings in the same family who were different ages when the family moved), but observational data cannot exclude it completely — this is the cascade model’s weakest link, named again in the methodology section below. So this passage’s verdict should be read as “the weight of current evidence clearly favors structure-first,” not “the culture camp stands refuted” — a conclusion that concedes the opponent still holds cards is worth more than one that declares total victory.
The dispute can, in fact, be pushed one level further: assume each thesis is true — what falsifiable predictions does each entail? If Murray is right (welfare incentives and norm erosion as first cause), at least four follow: first, the decay is a national cultural event and should not be graded by county-level trade exposure; second, removing the anti-work, anti-marriage incentives should revive marriage — and the 1996 U.S. welfare reform was precisely that quasi-experiment, slashing cash welfare and attaching work requirements; third, more generous welfare states (the Nordics) should decay harder; fourth, communities with strong norm-enforcing institutions (churches) should be immune to the shock. If structure-first is right, the predictions invert point by point: decay grades by exposure; welfare reform can move employment but not marriage (because the marriageable men never came back); the decisive variable is whether institutions protect jobs and status (Germany’s apprenticeships), not welfare generosity; norms can only delay, never exempt. The actual record hands all four rounds to structure: the geographic gradient exists; after welfare reform, single mothers’ employment jumped while marriage rates did not budge; the Nordics have no deaths-of-despair epidemic and no shortfall in prime-age male employment; the religious South delayed a decade, then converged anyway.
But a fifth test produced a split decision — and it is the most informative round of the match. Structure-first carries one strongest prediction: reversibility — if the marriage collapse is downstream of the male-earnings collapse, then wherever male earnings recover, marriage should recover. Kearney & Wilson (2018, REStat) ran exactly this experiment using the fracking booms of the 2000s: fracking did raise non-college men’s wages substantially — marital and nonmarital births both rose in response, but marriage rates did not move at all (Kearney has said her own prior going in was the opposite). Yet the same design applied to the Appalachian coal boom of the 1970s–80s yields a completely different answer: that time, marriage rates rose, marital births rose, and nonmarital births did not. The same kind of positive shock, thirty years apart, and the family-formation response function had changed. This is the hardest empirical card in the culture camp’s hand, and it forces the structure camp to sharpen its own formulation: culture is not an irrelevant variable but a one-way ratchet — structure can drag norms downhill, but when the money comes back, the norms do not climb back up on their own. The earlier phrase “amplifier and delay line” must therefore be read as bidirectional: on the way down, it delays the collapse (religiosity buffered the South’s first decade); on the way up, it delays the repair (the fracking puzzle). The policy implication sharpens accordingly: prevention is far cheaper than repair — which also plants a seed for the AI “window” discussion below: once a window has swallowed a generation, restoring the jobs afterward faces a response function that is no longer the original one.
The falsifiability yardstick must, finally, be applied to this essay itself. Link 1 of the cascade model makes one sharp prediction nobody else’s account makes: the marriage market prices male income asymmetrically — so a shock that mainly hits women’s entry-level jobs (which AI happens to be) should not replicate the deindustrialization-style marriage collapse, and should output some other form instead. That makes the AI shock itself an oncoming adjudication experiment: if, a decade from now, family-formation curves in AI-hit areas trace the Rust Belt’s, the “asymmetric pricing” mechanism this essay leans on repeatedly stands falsified. A model that can state what would kill it is the only kind worth taking seriously.
A model earns its keep by generating testable corollaries. Three examples. On policy: if the breaking point is “identity and dignity obtained through stable work,” then pure cash transfers patch income but not identity — there is early confirmation: the Alaska dividend and various UBI pilots show essentially no effect on marriage or family-structure indicators, while places where manufacturing rebounded saw marriage indicators partially recover. In one line: cash can’t buy back dignity. On cross-country comparison: Germany used apprenticeships and unions to protect the wages and status of non-college men; it went through the same deindustrialization without a deaths-of-despair phenomenon — Link 1 is universal, but the downstream links are modulated by institutions. On China: the same Link 1, layered under different institutional and normative constraints (non-marital childbearing faces real obstacles in household registration and school enrollment), predicts an output that is not American-style single parenthood but no marriage and no children — consistent with first marriages halving within a decade and the trajectory of birth numbers. The same first link: America outputs single-parent families; China outputs a falling birth rate. And the comparison runs one level deeper, to the political outlet. America’s belief depreciation found electoral expression: the inward-attributing became deaths of despair; the outward-attributing were organized, represented, and monetized into political coalitions. China’s depreciation has no electoral outlet, so the energy flows into individualized exit strategies instead — lying flat (exit from competition), the “run philosophy” of emigration (exit from the jurisdiction), the civil-service exam queue (exit from the market), money mules and the compounds (exit from legality). The same belief collapse; institutions determine the direction in which the pressure vents. Which venting mode carries the greater long-term systemic risk — organized anger inside electoral politics, or millions of silent individual exits — is a genuinely open question.
9. Pointing the model at the future: AI and the “window”
The cascade’s last input was deindustrialization, which destroyed non-college men’s jobs. The next input may be AI — and by the exposure estimates from Pew and others, this shock runs in reverse: female-heavy clerical, administrative, and junior-analyst roles are more exposed, and college graduates are more exposed than non-graduates — the opposite direction of every automation wave in the past eighty years. It attacks precisely the entrance to the “study → white collar → middle class” path. Which yields a pointed possibility: the sons of Fishtown, the community that sank last round, became electricians and plumbers — manual work plus on-site judgment, exactly what AI finds hardest to replace; while the marginal layer of Belmont, the community untouched last round — ordinary bachelor’s graduates under credential inflation — went into admin and junior analysis, exactly the most exposed roles. This time, the safer ones may be the former.
Early signals are already visible: for the first time on record, the unemployment rate of recent U.S. graduates has stayed above the overall rate; and a Stanford team’s study of ADP payroll data (Brynjolfsson, Chandar & Chen, “Canaries in the Coal Mine?”) found that within the most AI-exposed occupations, employment for the youngest workers (ages 22–25) shows a relative decline of about 16%, while senior workers in the same occupations are unaffected — precisely matching the “AI replaces entry-level tasks” prediction, and happening while aggregate unemployment still looks serene. Optimists read the aggregate data; pessimists watch the intake valve — the opening through which new people enter the white-collar system each year. When firms replace junior roles with AI, they save money today, but senior talent can only grow out of junior roles — the system is eating its own seed corn.
Why does replacement start at the entry level? A stretch of “reliability arithmetic” in the conversation lays the micro-mechanism bare: if AI completes a single step with 95% reliability, a twenty-step task chain succeeds end-to-end only about 36% of the time (0.95 to the 20th power). That is the gulf between demo and deployment — a demo needs to succeed once; deployment needs the one failure in a thousand not to be a catastrophe. So today’s AI lives inside an “intern paradox”: it can do an intern’s work, but needs a senior person to review it — it replaces the intern but cannot replace the reviewer. Which is why the real branching variable is not “will AI get smarter” but whether unsupervised reliability keeps climbing.
Claude gave the opposing camp its full due. The arguments of the Andrew Ng camp against “AI job doomsday” were listed one by one: two hundred years of crying wolf as historical base rate; tasks are not jobs (the classic case: ATMs were expected to eliminate bank tellers, but ATMs made branches cheaper to open, branches multiplied, and teller headcount rose for two decades — the job just shifted from counting cash to selling); real-world diffusion friction (electricity took forty years from invention to reshaping factory layouts); and demographic hedging — the labor force of developed economies is shrinking, and if AI arrives just as labor supply contracts, the two curves may roughly offset (Japan is the living example: the world’s highest robot density, where automation is welcomed rather than feared). Then each argument got its rebuttal, the hardest being: “the equilibrium comes back, but the people don’t.” The China Shock research shows that in hit communities, employment and wages had not recovered twenty years later; the textbook’s predicted labor reallocation — moving, retraining — simply didn’t happen. People sank in place. Keynes’s “in the long run we are all dead” is, here, literal.
The net assessment: aggregate doomsday claims lack evidence, but “the aggregate is fine” and “the structure is fine” are two different propositions — social damage has never required 30% unemployment, only the severing of a particular group’s path. In the inner cities of the 1980s and the Rust Belt of the 2000s, national unemployment was low throughout.
So all the disputes converge on one variable — the geometry of the window. This is the most abstract and most important concept of the whole conversation, worth taking slowly. What the cascade model says gets destroyed is not an income stream but an identity script: “graduate high school → join the plant → on that wage, marry, buy a house, be respected in the community” — a life script the whole society recognizes. Scripts have a defining property: they are negotiated collectively and slowly — they need parental example, institutional scaffolding, and validation in the marriage market; they form on generational timescales. Old jobs disappear on the fast clock (a plant-closure notice); new scripts form on the slow clock (a generation). The “window” is the crack between the two clocks. What is life like inside the crack? Picture a 35-year-old Rust Belt man: the old script (join the plant, provide for a family) is physically unexecutable; the new scripts either collide with his identity (retraining into nursing reads as bankruptcy of the provider role), or exceed his capacity to relocate, or simply haven’t been invented yet. It is not that he has no work to do — it is that no road open to him leads to self-respect.
“Last time, the window stayed open for thirty years” refers to something specific: U.S. manufacturing employment fell from its 1979 peak (about 19.5 million) to a bottom around 2010 (about 11.5 million), while the replacement scripts — a service economy, dual-income households as the default, “everyone goes to college” as the new standard path — did not stabilize until the 2010s. Those thirty years in between were the crack, and it swallowed precisely the cohort of non-college whites who entered the labor market during the shock: too late to accumulate seniority in the old system, too old to board the new script. They are exactly the people on the upward-bending stretch of Case & Deaton’s mortality curves. So what determines the social cost of the AI shock is not how many jobs ultimately disappear, but the difference between “the rate at which old jobs vanish” and “the rate at which new identity scripts get built” — add up that difference over time (mathematically, take the integral), and you get the total number of people who fall into the crack.
Beyond the window lie two branches, each with a historical calibration:
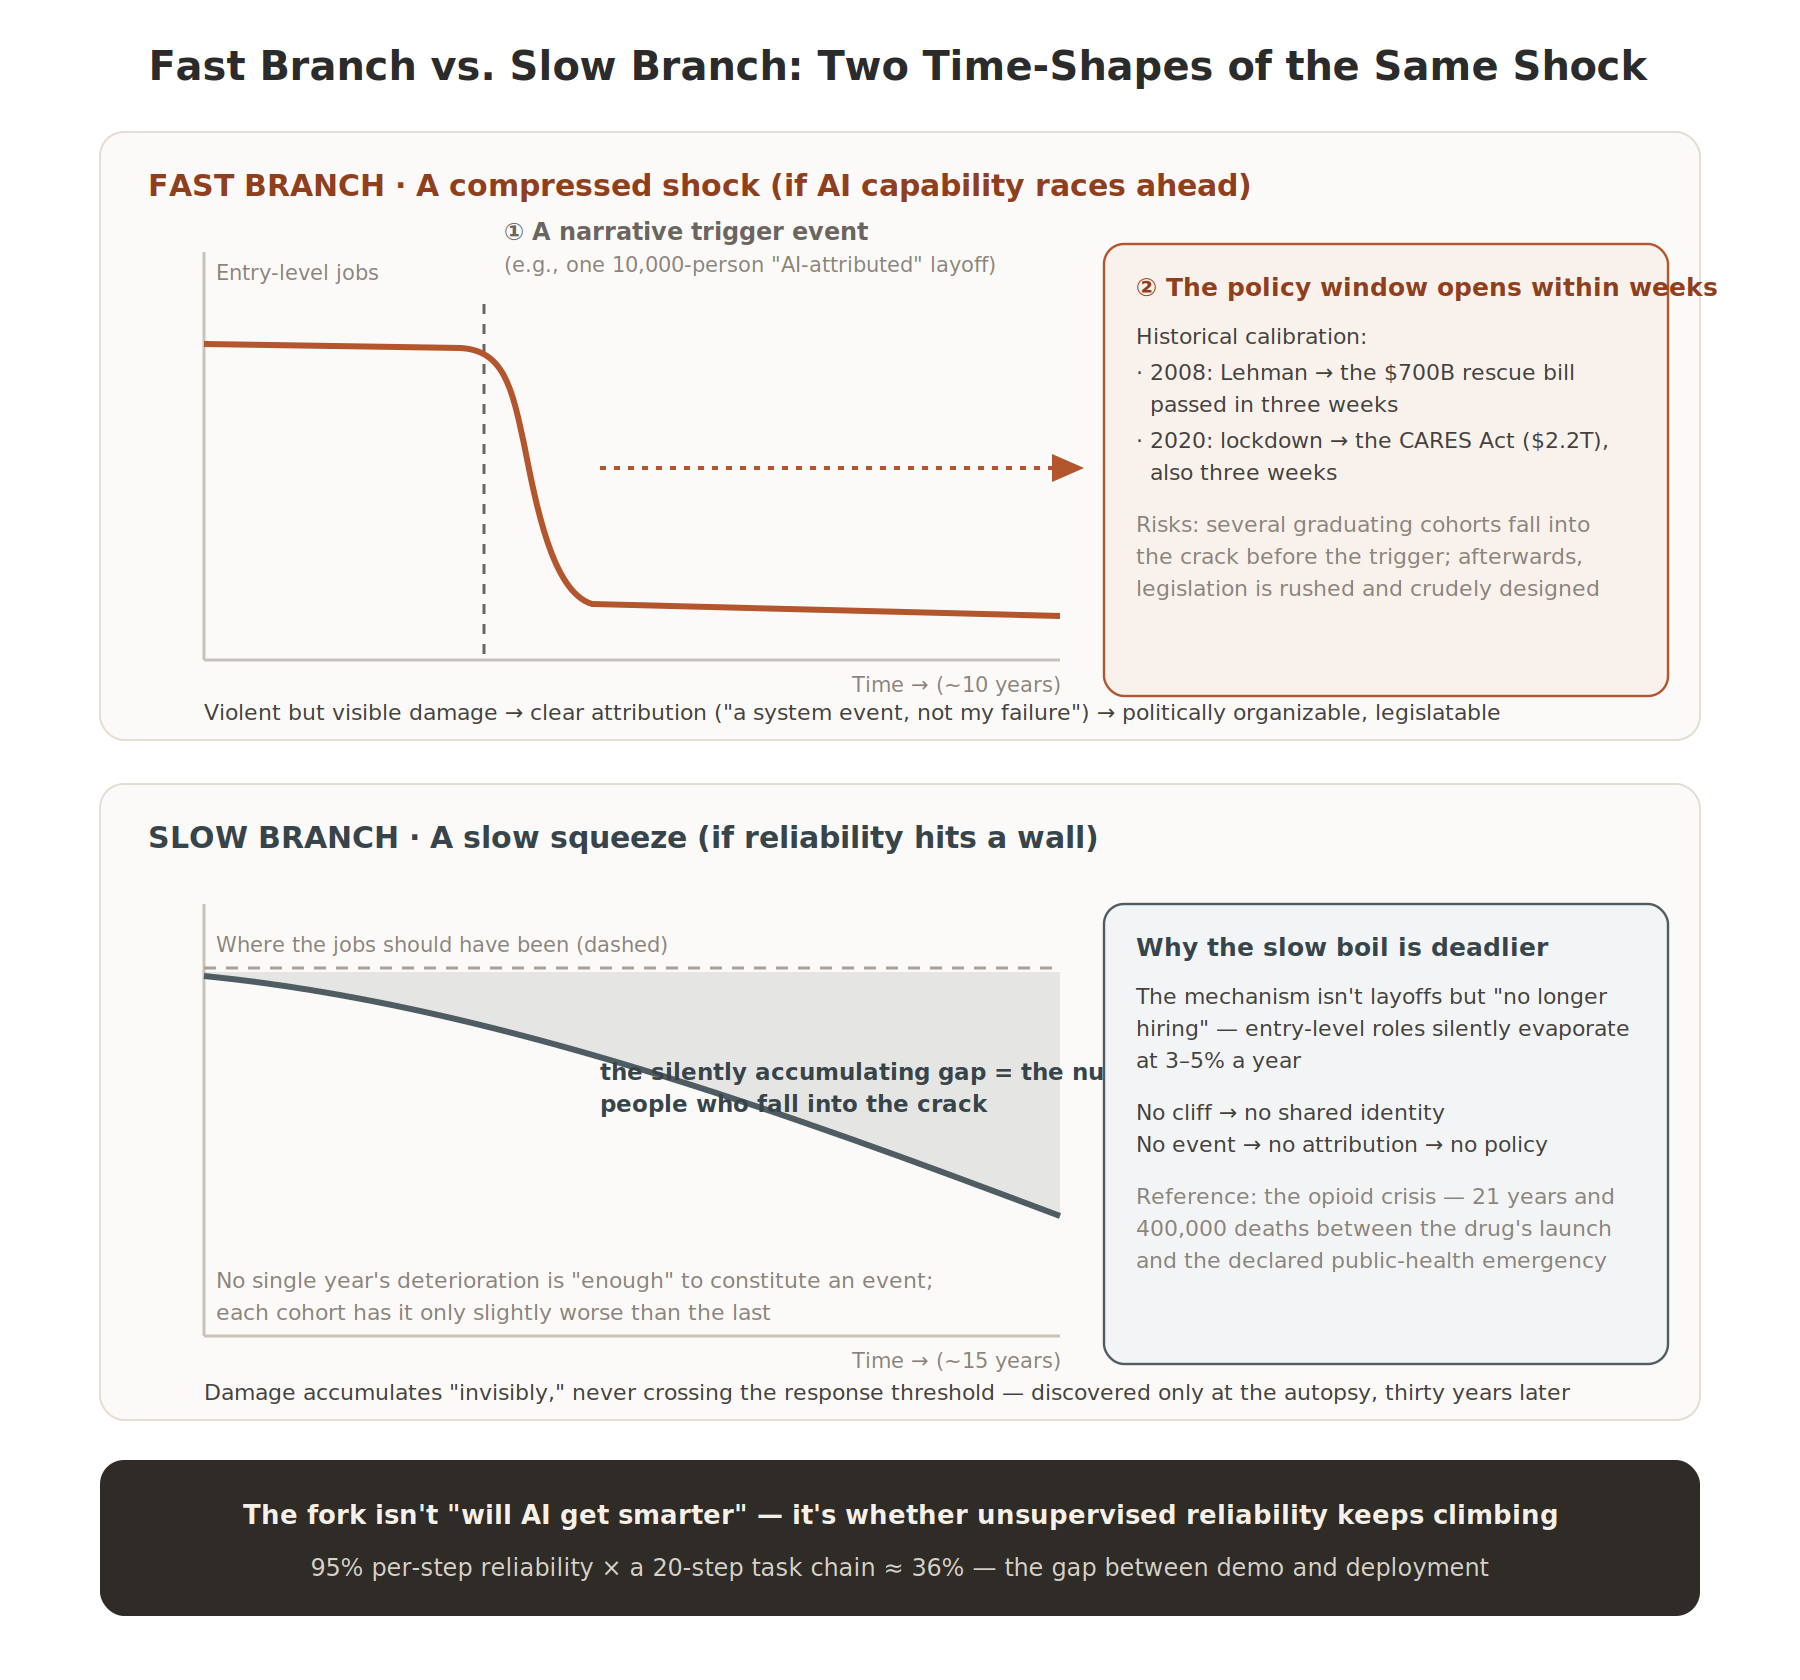
The fast branch (AI capability races ahead; a compressed shock): political systems look sluggish, but history shows they respond with startling speed when a narrative event is big enough — 2008, from Lehman’s collapse to the $700 billion rescue bill, three weeks; 2020, from lockdown to the CARES Act (including direct payments to everyone, $2.2 trillion), also three weeks. So the fast branch’s risk is not “no policy response ever,” but a response that is politically impossible before the trigger and rushed and crude after it. The slow branch (reliability hits a wall; a fifteen-year grind) is actually more dangerous: its mechanism is not layoffs but “no longer hiring” — each graduating cohort has it only slightly worse than the last; no cliff means no shared identity, no event means no attribution, no attribution means no policy. The reference case is the opioid crisis: twenty-one years passed between the problem drug’s 1996 launch and the federal public-health emergency declaration in 2017, with cumulative deaths reaching 400,000 — and in no single year was the increment “enough” to constitute a national event. The slow boil is deadlier, because it never triggers a response.
The conversation closed with a checklist of leading indicators for judging which branch we are on. First on the list: watch how fast AI-agent products shift their billing unit from “per conversation” to “per completed task” — the logic being that for a company to let AI run whole tasks unsupervised, it must insure against errors; when insurers are willing to underwrite and actuaries can price the risk, error rates have become measurable and predictable. That signal is more honest than any benchmark leaderboard, because insurers bet real money. The other indicators: whether the 22–25 employment gap spreads upward into the 26–30 cohort; and the wage trajectory of “AI-output review” jobs — if these supervisory roles are still gaining pay, the reliability bottleneck is alive (slow branch); when they start disappearing, that is the fast branch’s earliest canary.
And one live-fire exercise already underway: the data-center resistance movement. In the first quarter of 2026, at least 75 U.S. projects worth about $130 billion were blocked or delayed; Gallup finds 71% of Americans oppose a data center near their home — a higher opposition rate than nuclear plants. Among the drivers, the most efficient piece of political mobilization material is the electricity bill: one Virginia resident’s monthly bill jumped from about $100 to $281. The structure rhymes exactly with the politics of globalization: AI’s benefits (equity appreciation, productivity) are concentrated and abstract; its costs (power prices, water, noise) are dispersed and land concretely in specific zip codes. Last time, the losers took twenty years to find political expression; this time, the resistance organized before the benefits even arrived — because the electricity bill is an immediate, monthly reminder.
III. Methodology: Why This Conversation Worked
The process is worth recording more than the conclusions. On review, five mechanisms were doing the work.
First, interrogate mechanisms, not phenomena. Every round’s question took the same shape: “you mentioned X — expand on that,” “what does this mean,” “how reliable is this conclusion.” Never settle for description; force it to surrender every link of the causal chain. Claude’s own retrospective summary: this was the stress-testing workflow of investment research applied to social science — always asking about mechanism, attribution quality, and falsifiability, never about narrative satisfaction.
Second, mandatory sourcing. In high-effort mode, every one of Claude’s answers came with real, clickable sources: official releases from the Ministry of Public Security and the Supreme People’s Procuratorate, paper pages on PubMed and ScienceDirect, journal originals, think-tank reports. More importantly, it graded its sources: first-hand official statistics, peer-reviewed research, field ethnography, investigative journalism, behavioral revealed-preference data — each stated with its own evidentiary strength and limitations. When I pressed on the reliability of “Chinese pathological gambling rates are higher,” it did not defend the number it had cited a round earlier; it dismantled that study’s sampling flaws (convenience sample, 27.4% response rate) in front of me.
Third, counterarguments as a default setting. Nearly every major claim was followed by “here is what needs stress-testing”: the case that prohibition does suppress the total market; Ruhm’s supply-side challenge to “deaths of despair”; the history of exposure estimates over-predicting job losses (ATMs and tellers being the classic counterexample); the cascade model’s own weakest link (the observational evidence on community effects cannot rule out selection). None of these counterarguments were requested. They were volunteered.
Fourth, confidence layering. In the ten-to-twenty-year AI projections, it explicitly split predictions into a high-confidence layer (extrapolation from existing data), a medium-confidence layer (structural reasoning), and a low-confidence layer (branches contingent on AI’s capability path), attaching adjudicating indicators to the branches. This lets a reader bet on each layer separately instead of accepting or rejecting one whole narrative.
Fifth, declaring its interests. This was the part that surprised me most. More than once, unprompted, it stated: the entity assessing AI’s employment impact is a model trained by an AI company; the fast branch validates its technology narrative, the slow branch eases its regulatory pressure — “borrow the logic chain; set the weights yourself.” Its closing line for the whole conversation: this skepticism is precisely the best immunization against the question we started with — what gamblers have in common is that they stop auditing their own model.
IV. Limitations and Self-Examination
The boundaries of this way of working must be written down honestly. First, retrieval plus citation does not mean exemption from checking: after drafting, I searched and verified every reference in this piece one by one (the links in the text are the results of that check), and genuinely caught errors — in the conversation, Claude placed the Fan-Yi-Zhang paper in the Review of Economics and Statistics when it was actually published in the American Economic Journal: Economic Policy; and Chetty’s 1940-cohort figure was corrected from “about 92%” to the paper’s “about 90%.” The core arguments survive, but the lesson stands: every citation an AI hands you deserves a trip back to the source before you publish it. Second, the projective parts of the conversation (the cascade model’s corollaries, the fast and slow branches) are structured conjecture — their value lies in falsifiability, not correctness; the leading-indicator checklist exists to embarrass itself in the future. Third, the coherence of a single conversation is itself a temptation: folding the betting table, the exam hall, the Rust Belt, and the data center into one framework is elegant, but elegance is not evidence, and reality is entirely free to be messier than the model.
Further Reading
Works cited repeatedly in the conversation and worth reading in full (every link verified individually):
- Martin King Whyte, Myth of the Social Volcano: Perceptions of Inequality and Distributive Injustice in Contemporary China (Stanford University Press, 2010), and the follow-up tracking studies
- Yi Fan, Junjian Yi & Junsen Zhang, “Rising Intergenerational Income Persistence in China” (American Economic Journal: Economic Policy, 2021)
- Xiang Zhou & Yu Xie, “Market Transition, Industrialization, and Social Mobility Trends in Postrevolution China” (American Journal of Sociology, 2019)
- Liang Chen, James Lee, et al., A Silent Revolution: The Social Origins of Peking University and Suzhou University Students, 1952–2002 (Social Sciences in China, 2012; book edition, SDX Joint Publishing, 2013)
- Thomas Piketty, Li Yang & Gabriel Zucman, “Capital Accumulation, Private Property, and Rising Inequality in China, 1978–2015” (American Economic Review, 2019)
- Yuen Yuen Ang, China’s Gilded Age: The Paradox of Economic Boom and Vast Corruption (Cambridge University Press, 2020)
- Minxin Pei, China’s Crony Capitalism: The Dynamics of Regime Decay (Harvard University Press, 2016)
- Andrew Wedeman, Double Paradox: Rapid Growth and Rising Corruption in China (Cornell University Press, 2012)
- Raj Chetty et al., “The Fading American Dream: Trends in Absolute Income Mobility Since 1940” (Science, 2017)
- Anne Case & Angus Deaton, Deaths of Despair and the Future of Capitalism (Princeton University Press, 2020)
- David Autor, David Dorn & Gordon Hanson, “When Work Disappears: Manufacturing Decline and the Falling Marriage Market Value of Young Men” (AER: Insights, 2019), and the China Shock paper collection
- Charles Murray, Coming Apart: The State of White America, 1960–2010 (Crown Forum, 2012)
- Robert D. Putnam, Our Kids: The American Dream in Crisis (Simon & Schuster, 2015)
- Kathryn Edin & Maria Kefalas, Promises I Can Keep: Why Poor Women Put Motherhood before Marriage (University of California Press, 2005)
- Andrew J. Cherlin, Labor’s Love Lost: The Rise and Fall of the Working-Class Family in America (Russell Sage Foundation, 2014)
- Arlie Russell Hochschild, Strangers in Their Own Land: Anger and Mourning on the American Right (The New Press, 2016)
- Melissa S. Kearney & Riley Wilson, “Male Earnings, Marriageable Men, and Nonmarital Fertility: Evidence from the Fracking Boom” (Review of Economics and Statistics, 2018)
- Scott Rozelle & Natalie Hell, Invisible China: How the Urban-Rural Divide Threatens China’s Rise (University of Chicago Press, 2020)
- Ivan Franceschini, Ling Li & Mark Bo, Scam: Inside Southeast Asia’s Cybercrime Compounds (Verso, 2025)
- Erik Brynjolfsson, Bharat Chandar & Ruyu Chen, “Canaries in the Coal Mine? Six Facts about the Recent Employment Effects of Artificial Intelligence” (Stanford Digital Economy Lab, 2025)
This piece was produced in collaboration with Claude Fable 5 (high-effort mode): the in-conversation retrieval, literature synthesis, and model-building were performed by Claude; the design of the question chain, the fact-checking, and the writing of this article were done by the author. Every figure in the text can be traced back through the original citation links in the conversation.


